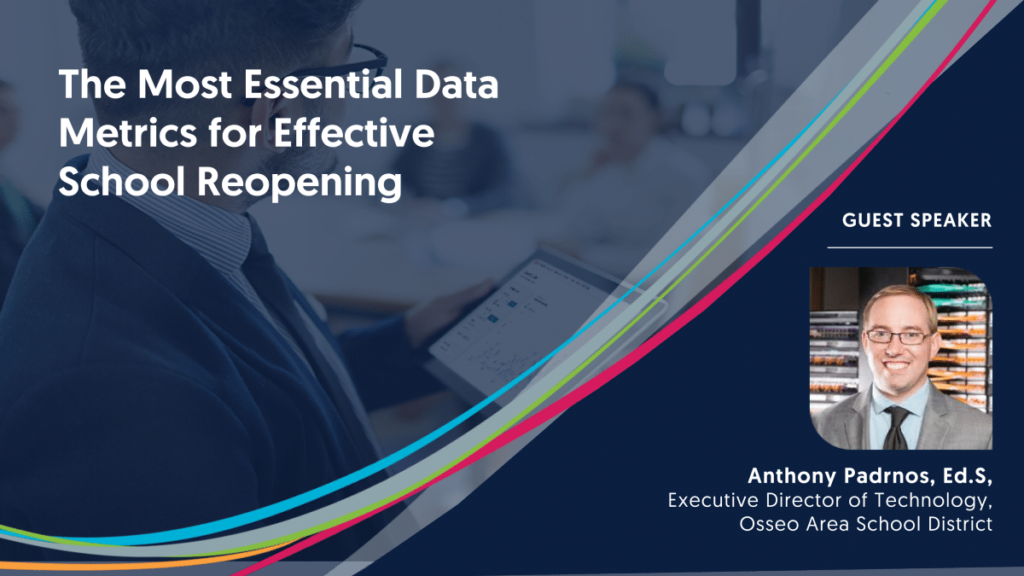
0:03 (Marissa Naab from Lightspeed Systems)
Good afternoon. Thank you all for joining us today. We have a great discussion on that, and we’re super excited to go into this content. We’re just a few minutes early, so I’m gonna give folks a couple more minutes to go ahead and join us. So, thanks for joining us, and we will begin shortly.
1:09
It looks like we’ve had a couple more folks join us, so let’s go ahead and get started. My name is Marissa. I am on the webinar team here at Lightspeed Systems. I think you all so much for joining us today. I know your schedules are super busy, so we appreciate you taking the time to join us for this awesome discussion on data analysis, and going back to school.
1:31
A couple of quick housekeeping items before we get started with the presentation. We will be recording today’s session, and we will be sending you the recording once the session concludes. So you can share with your colleagues, or view it at a later time, or really do whatever you want with it. So we will be sending that to you.
1:48
We also will be doing a Q&A session at the end of today’s discussion. So, if at any point during the webinar in the question about any of the content that is discussed, please enter that in the Chat box. And we will make sure to get to it at the end of the session.
2:04
And last but not least, we will be sending out a survey at the end of the webinar. If you want to fill that out, we will send you a $10 Starbucks gift card.
2:14
So, yeah, that should pop up.
2:15
Once you exit the webinar, and as you fill out the survey, we will be sending you a gift card, So, that’s great. Without further ado, I would like to introduce our two panelists today, Anthony Padrnos, the Executive Director of Technology at Osseo Area Schools, and Regional Sales Manager here at Lightspeed Systems. Anthony, would you like to go ahead and tell us a little bit more about yourself?
2:42
Yeah.
2:46
Give me a second here. Let me get my screen up.
2:53
All right, everybody should be seeing my screen. A good afternoon everyone. And thank you Marissa. I’m Anthony Padrnos the Executive Director of Technology for Osseo Area Schools. I’ve been with the Osseo organization for almost four years now. Previous to being at Osseo, I served as the Director of Technology with Richfield Public Schools, Southern Suburb of the Minneapolis community.
3:22
While I was there for approximately 3.5 years, I led technology, redesign, and planning to focus on how we utilize technology to meet our instructional outcomes as an organization, as well as lead curriculum development, the implementation of professional learning communities.
3:41
I led the district data and assessment team there, and I did a short stint as the principal of the alternative learning center. At my time there, prior to being with the Richfield schools, I was worked with the Hopkins Public School District, Western suburb of the Twin Cities, Minneapolis Saint Paul, Twin Cities area, Minnesota. I served there for many years as a high school math teacher and then a digital learning coach to work with staff on how to improve their instructional practice through the use of technology.
4:17
I’m excited to present today on know how Osseo has gone through our journey around data and analytics to look at how we navigate through the pandemic and drive instructional practice and outcomes as we continue to move forward.
4:37
So a little background about the Osseo Area Schools: We serve approximately 20,300 students. From a Minnesota perspective, we are the fifth largest school district in the state of Minnesota.
4:50
We’re serve eight communities that make up the north-west suburbs of the Minneapolis area and in Minnesota our student population is very diverse. 60% of our student community is represented by our BIPOC community. We have about a 10% student population that is learning English as a second language, and 14% of our students are receiving additional services through our Special Education programming. We have 29 school sites made up of 17 elementary schools, four middle schools, three high schools, one Alternative Learning center, and two early Childhood centers.
5:32
And the Adult Basic Education Center and starting this year with the pandemic and creating options for our families. We launched our first K through 12 online program, Permanent Online Program where we currently have about 25% of our students who have elected to take full-time remote learning during the course of the school year, and that will be continuing as one of our permanent schools as we move forward.
6:03
So, when we think in our seal around data collection and analysis, I want to start with, I’ve had a lot of experience and opportunities partnering with teams and organizations around leading data work. That I’m by no means the data experts. And for many of you who are participating in this call, I know you are engaged in working with data all the time. And know, as well as I do that, the path around data, and utilizing data to drive outcomes, is a journey. And we’re all on this journey together. And that journey around data evolves over time.
6:45
And every system needs to start somewhere.
6:48
And they need to work on building capacity and culture within their organization around what does it mean to look at data and utilize data as part of what happens in the classroom, all the way up to, to the boardroom.
7:03
Serious schools have been on this data journey for a long time. It started prior to me even being a part of the school district.
7:13
Coming on four years ago, the school system organization really worked, and looked at outcome data, and what that meant, and how do we break outcome data out by different demographics to understand what is actually happening from, from an instructional lens. PLCs, professional learning communities, or PLCs, as we call them, professional learning teams, have been operational in Osseo for a long time. Really creating that culture in the classroom space of teachers, looking at formative assessment, data on summative assessment data, and analyzing that against what their instructional practices to try and improve what they’re doing from a practice standpoint. And all of our school sites actually have, what we call student teams. Student improvement teams. And these teams specifically look at behavior, attendance, and academic data for the students within their school site, to understand where there might be gaps or needs for targeted intervention within their space.
8:20
But really, as the pandemic, you know, hit all of us.
8:24
We had to really kinda rethink, and then evolve our approach around data, on what data means, and how we gather that data, and how we look at that data, and how we take next steps in really, what’s evolving within our education system. Through the experience we’ve all been going through.
8:45
And for us, when we look at, you know, data as a process, it really falls into three kind of categories: identify, collect, and analyze. And, really, when we think about identifying data, it’s really going to what is the goal, or what is the question that we are trying to answer for our organization as we drive our work forward. And, really using that to determine the actual data that’s needed to answer that question.
9:17
From there, then, we can start thinking about our collection tools. Do we use a survey that we look at our different systems and tools? You know, where are we collecting or gathering that data in different places for our organization, for many years and for many of your organizations, you gather a lot of data and it’s scattered throughout different places a spreadsheet here, a database there, a system here in a system there and trying to figure out where all that data is, can sometimes be it be a challenge.
9:48
But, you know, that’s the next piece of figuring out how do you collect that? And how do you gather that and get that in a central place that you can then take that next step of really analyzing it?
9:57
And, you know, really, getting to that place of making meaning and developing action from that data.
10:07
And education, is an entity that is very data rich, and oftentimes information poor. And, you know, what I mean by that is, we’ve got data points everywhere, data’s being collected, and a multitude of systems.
10:23
And it can be challenging at times or take a lot of time to actually pull all that data together.
10:29
To finally, get it into a, you know, a bar graph or a line chart or up scatter plot in order to just see what’s happening. You know, nonetheless of trying to make now meaning and drive information out of that, to take next actionable steps within your organization.
10:49
And so, as we navigated into the pandemic, you know, we had to think about what is it we’re doing and what do we need to gather, and why do we need to gather that. And there’s kind of three areas, or three spaces that we started to look at gathering targeted data points on, and this is really are identified piece, and it was student engagement.
11:14
Teacher supports, and then, ultimately, this year, we started getting back into, looking at the student outcome piece, you know, historically, if we think about educational organizations, we often are hyper focused on student outcome data. That oftentimes is our state standardized assessments we’re often held accountable as school systems to these standardized assessments, and they are a good data metric and a data points.
11:45
But they’re really hyper focused on that outcome data.
11:49
As opposed to some of the practices and opportunities that actually are driving that outcome at the end. So, you know, this is an area where Osseo has, you know, been working on and evolving around and as we started into the pandemic last spring, we really hyper focused our data collection, less around student outcomes and really around student engagement. And not necessarily around our traditional thinking of student engagement, of are they engaged in the learning, but just starting with our students connected to school. Can we see them? Do we know where they are? Because that was vital as what we’ve kinda coined this spring timeframe as our emergency learning period. We got thrust into this distance learning space, which was a new and chaotic environment for our staff, our students, our families, and our communities at large. And, we really wanted to make sure that students were still connected and engaged with our school system, so that we could still find ways to build community and attach resources to support our young scholars through, through this challenging time period.
13:06
Now, that continued to evolve as we went through the spring, and started gathering some additional data points through surveys to students and staff, and families to really understand the practices that were occurring within this remote learning environments, along with, you know, making sure our students were engaged. And, starting to work on identifying where were we going to go, and what was going to happen next as we came back into the fall of the school year.
13:37
And, and ultimately, utilizing student engagement, where they connected to school, moved into, and morphed into how our students actually engaging within our learning spaces.
13:50
And that’s one of the beauties and values of technology that, I think got amplified during this period, that there’s a lot of new data points that we can engage with and look into. Those data points have always existed, but we haven’t necessarily looked in and pulled them out through our different systems to see how students were interacting and engaging with learning opportunities that were developed through digital platforms that allowed us to understand that engagement from an instructional lands, and start to identify through the surveys and that component, what and where the gaps are, the supports that were needed for teachers to be effectively. So are effective and in their instruction and the teaching space.
14:38
And how do we gather resources to support our teachers to bolster what they need from an instructional practice.
14:46
Those have ultimately led, as we’ve evolved into this school year, to then start to back and some of the student outcome data and look at what that means. If we have students engaged in the learning, for teachers, have the correct supports, we should start seeing the, ultimately the outcomes that we want to see. And, we are starting to see some of those, those connections. We’re also using and identifying where you know the potential gaps exist within our students and our communities to create, you know, what our next iteration of learning is going to be as we get into planning for the next school year.
15:27
You know, fortunately, for us, in Osseo, as we look at some of the digital tools and the digital learning space, you know, our organization is bend down a path of digital learning for a long period of time. We’re going on about eight years that we’ve had some form of 1–to–1 device implementation within our system, again, being utilized to varying degrees by our teachers, when we were in a traditional learning format.
15:59
That created new opportunities for us as we went into distance learning to rethink some of those spaces. And really re-emphasize with our teachers, our core strategies, within our digital learning plan.
16:11
That’s, you know, less focused on technology and more focused on the instructional practice and the learning environments we want to create for students around what we use as our tenants of path, pace, and place.
16:24
And you know the pandemic and distance learning that, you know, came into play really, kind of, put teachers in a space where they had to really embrace opportunities to differentiate, thinking that students might be coming and going in different places and experiences within their learning. How to meet them, at where they’re at, to kind of put them on a case for success.
16:52
And then really understanding different pathways and modalities to engage students, as we’ve gone through the learning experience with our students.
17:05
You know, as we think about how we started to collect this data, to utilize it to drive our practice, you know, engagement data was kinda the first place, as I mentioned, where we focused on, and there’s really three areas that we looked at for this student engagement with our system. You know, we had the traditional attendance data that we looked at, and we really had to, over the last spring to the school year, really rethink what does. How do we collect attendance data?
17:36
What does attendance look like in the State of Minnesota?
17:40
As we were, you know, engaging last summer, around how, what does the fall look like for learning?
17:47
You know, we were directed by our Department of Education to create three different plans, a distance learning plan, where students were 100% remote, a hybrid learning plan, where we’d have portions of students in, and then, a full in person learning model with, you know, with safety protocols in place, and how schools would operate within that space. And, you know, for our organization, we started in the fall in distance learning format for two weeks. We came back into a hybrid learning mode for about a month, and we shifted into distance learning mode for much of the winter timeframe, as the Covid case rates went up. And we know, now, have been, for weeks into full in person learning with our students.
18:36
So, you know, we really had to spend a quick amount of time with a lot of key stakeholders over the summer to create learning pathways for our students and our teachers that would allow for shifts and modality in those, those learning spaces.
18:55
You know, so as we thought about attendance data in the spring, we were, we were kind of loose on what we counted for, for attendance, and learned through that space last spring that we needed to kinda tighten up our attendance protocols and kinda get to a more traditional tenants format, but also rethink what does the traditional practice of attendance look like if a student is showing up in a digital space?
19:22
You know, they check into a class at, at 8:00 PM, is that OK? Do they have to show up in the same time frame?
19:28
So we had to wrestle around what that that meant and let it looked like. But also, looking at the tools and the systems. As I mentioned, our software tools really provide a lot of data, and two of the systems that we used a lot, and still use a lot to gather this engagement data is Lightspeed Filter by Lightspeed. So really, is the tool that I mentioned, we use for our filtering. But this tool has been highly valuable, because of the dashboarding and the reports that this pulls out for us. So, it tells us, are our students connecting with their district issued devices, and when they’re connected to their district issued devices, what are they doing on it? Is it educational related? Isn’t non educational related? How much time are they spending on it? What software applications are they going through in their learning space? How much time are they spending within these different applications?
20:21
So, it’s all new engagement data that we could bring in and see on how students were actually interacting with the learning activities in the learning spaces that were being created in this digital space. And then our learning management system. So, you know, we went into our learning management system, which has a lot of data in there as well. And, you know, really thinking about our learning management system as this is now what we traditionally thought of as the physical school. This is the physical school in the digital space. Are students showing up in that digital space? Are they engaging with the learning activities that are being placed within that that space and navigating around to get what they need to be successful.
21:14
You know, there was other data metrics that we collected as well to get to these data points.
21:18
So, you know, we historically have done an annual survey every year, and we took that annual survey and kind of shortened it to look at, you know, how do we gather short responses in a shorter survey, from families, students, and staff, to understand the experience that they’re going through and really drive into opportunities for us to improve. So, we created what’s called a pulse survey that we provided each trimester in our organization to do that, you know, quick dip, check in to see what’s going on with families and students and staff.
21:56
And then be able to drive strategies to help support all of them as we continue to move through the school year. Well, you know, providing that survey, again, at our different periods, in time, to actually measure whether we’re improving on what’s coming.
22:12
And then, as I mentioned, you know, the outcome data did finally come back in this year, and looking at, you know, again, and how is the engagement starting to translate into some of that outcome? So, we’ve got our Trimester Grade Reports. We have a standardized internal standardized assessment tool that we use called Fast Bridge. It is a progress monitoring assessment tool that we provide to all students, K through 8, that provides us ongoing outcome data for us to understand and where we’re at, and how we’re driving our work forward. As well as, we’re currently in the throes of doing our state standardized assessment, which was canceled last spring. And Minnesota as keeping it going forward. This year, as all many of your states are.
22:56
And so we’re in that, that window right now to really, again, use that as an opportunity to understand what needs exists as we start mapping and planning for the course of next school year.
23:12
As our new normal of learning environments continue to evolve when we think about, you know, the analysis portion of our data. It’s one thing that collected and gather it and see it. And you know this spreadsheet here as I said, and this database over here, we have really been working even pre pandemic to find solutions to help us, technology solutions to help us with our data analysis. So, we’re fortunate in that we have a very skilled research and assessment team that can do a lot of this data analysis work. But we’re trying to work on evolving to spend less time having to process all that data and more time, using our teams and our expertise to help drive meaning and information for action.
24:04
So, you know, the two systems that we look at heavily now is Analytics by Lightspeed and Lightspeed Filter, which brings us from the technology lens, a lot of information related to our software solutions, our instructional software solutions, and our technology, and how it’s being used and integrated into the classroom. And we can have a lot of rich conversations with our teaching, learning, and achievement departments around how our practices happening within the learning space, whether it be digital or in person, and how are the tools that word we’re purchasing, or using in our system, amplifying. And supporting the outcomes that we want to see in the teaching practices that we want to occur.
24:54
Hoonuit is our other platform that we use as our business intelligence solution that we actually are using to consume all the rest of our data and help build meaning out of it.
25:05
So, that brings in our assessment data, it brings in our academic data, grade data, behavior, data, attendance, data, and allows us to correlate that, and do kind of, ABC work, attendance, behavior, and credit and pass rate correlations and break that out based on different demographics to understand how our work is as we move forward. We also have a couple of internal data analysis processes that still occur. one of them is what we call a promising practices study.
25:39
So, we actually kinda take a cohort, or a sample of teachers, and their students, and look at the practices that are happening in their classroom related to practices and strategies that we have identified as a system as being best practice.
26:00
And looking at how are they actually translating into success or outcomes with our students. So, we’ve been able to, you know, do some of that work to really understand. And, in particular, related to my work with digital learning and the digital learning strategies that we use, how staff are implementing are pillars of path, place and pace and utilizing technology to create those learning spaces.
26:29
We’ve been able to identify and demonstrate that when teachers are really taking those tools and using them as we’ve been providing professional development on and embracing that environment we’re trying to create, we’re seeing the outcomes that we want to have created with the use of technology and instruction, whether again, whether it’s in the physical space or the remote space.
26:54
Then, again, with our Pulse Survey data, again, often, you know, survey data can’t come into your larger, all your larger systems yet. So sometimes, you might be using Google Forms to bring that data in. Or, you know, a variety of other survey tools out there that will do some quick analysis.
27:11
But we are taking that data in and creating a grid from green to red. That we can provide to board members. And school leaders around that survey data, as it comes in related to the different strategies and questions and supports that are being identified as needed between our different student groups and our families, as they provide a lot of valuable information to us. We’ve also been able to kind of look at that engagement data and cross that with some of our academic and Pulse Survey data, which, again, is still somewhat of a manual process.
27:46
And we’re looking at how we can build into our Hoonuit or, you know, utilize the Lightspeed system to help simplify the analysis piece. But really do some crosswalks.
27:58
And, you know, we’ve been able to demonstrate some relationships of that engagement data we’re pulling out of Lightspeed Filter and our learning management system that the more students are engaged with those learning activities. It is transpiring into increased academic outcomes, or course pass rates. So, you know, we’re excited to see how we’re starting to bring and link those data pieces together, to really drive our work as we continue to move our organization forward.
28:34
You know, as I’ve touched on some of those software pieces with Lightspeed Analytics and how do you determine, you know, apps and tools and, what to keep and what, you know, to cancel within your organization. You know, this has really been a lot of my work in Osseo for the last three years and understanding what platforms are in our system. How are we using them? Why are we using them and are they getting to the outcomes that we want to get to?
29:07
And again, the pandemic has created a whole new space in particular around software solutions and instructional tools or instructional digital resources that our staff are using in a whole new way and innovative ways to really start to drive positive outcomes with our students.
29:26
But ultimately, pre pandemic and during the pandemic, and planning for next year, it always comes back for me and our team to instructional goals, one of the things that’s core to us as an organization, as we talk about digital learning, is that it’s not about the software. It’s not about the technology.
29:46
It’s about the student outcomes and the instructional practice, what is the environment we want teachers to create? How do we want them to teach and engage students?
29:56
And then how do these different technology tools and technologies come in to support that and amplify that and actually make that occur? So, you know, that’s the mindset. We actually go in before we actually to evaluate a digital resource or a tool before we bring it into our system, and it’s the way that we continue to evaluate its effectiveness as we move forward within our system.
30:22
And, you know, as we worked through this year and looked at different resources that were coming in. As many of you, every instructional software vendor that was out there was ready to offer every teacher in every system of free access to their tool which was, you know, a great support to some degree during the course of the start of the pandemic but, you know, we’re starting to get to a space where we need to think about long term. What does that mean? And, so, you know, having that instructional goal in mind. The next piece we have to think through and process through is budget capacity.
31:01
And we’re all working with finite budgets in our K–12 school systems and CARES dollars that, you know, we receive through the federal government work great, but it is a one-time infusion of money for our systems, and long term, how do you manage financial sustainability? Because technology has an ongoing cost on it. If there’s thinking about if you bring in hardware, that hardware is going to have to be replaced. If you bring in software, there’s gonna be annual software subscriptions that go with it. And so, you know, one of the tools that, you know, have been, that has been valuable for us to bring in was really [Lightspeed] Analytics, which really can bring in the data of our usage and our adoption rate within those software tools that, we’re investing in. So, prior to having that tool, again, we would work on gathering that data, we would go onto the back end of the software and see what’s happening. We would go into classrooms and observe how was being utilized and engaged with. So it was a lot of legwork to gather that data, which we did and we can, and looking at how we can do that quicker and get some more actionable opportunities with that data, that really Analytics tool really helped us with that and evaluate adoption.
32:25
And, so, you know, one of the pieces that, you know, we, we came to learn real quickly is, we had a learning management system, a universal learning management system, for kindergarten students all the way through, through 12th grade prior to the pandemic occurring.
32:40
And, anecdotally, we kind of knew it, it wasn’t a solution that was fitting or meeting all of our grade level needs. And the Analytics tool helped us to get the data in a meaningful way that forced what we we’re already seeing and hearing with within our space.
33:02
So, we made a significant move at the start of this school year to have a different learning management system, 6 to 12, than we did in pre K through 5. So, we would have the right tool and an effective tool for our learners within those spaces in order to navigate and engage with the digital learning and the digital or resources that they needed to be successful as a student. It also has helped us, as we brought in some new tools, as many of you may have, to do we want to actually continue with these. And so, there were some new tools that we were hesitant on historically to bring into our system because we have seen and observed some misuse that didn’t necessarily aligned to our best instructional practices that that we wanted to occur in the classroom, but we also recognized as we went into this remote learning environments that all teachers were thrust into that. We, we might need some, some bridge supports and some digital tools that will help them to get to what, what needs to occur and a learning space.
34:17
And, you know, we brought in some tools that really got effectively utilized, because of the conditions of the environment that we’re now working in, that we identified, as those are, you know, effective tools, that we can continue on with practice.
34:36
Because we implemented it and curved it in a way that is really driving the intentional practice that we want to occur with the usage of that tool. The other piece, when we think about onboarding and off boarding tools, is, you know, we really learned from students and families last spring prior to coming into this school year, that we just had too much.
35:04
We had, you know, teachers were utilizing a lot of different free tools and free resources, and it was becoming very cumbersome for students and families to navigate that digital environment, especially when, you know, they’re not in the classroom. And you might have a teacher find a really great tool, a free tool that they want to bring in and utilize. When they bring in and utilize that inside of a physical classroom setting, there’s that intimacy with the students in the classroom to help navigate them and get them through that. Where, when we’re in a remote or a distance learning environment, that is much more challenging for, you know, the teacher to provide those direct supports to the students in the family to understand how to support their child in that learning space. If, if they’re able to.
35:51
So, you know, we really moved towards and had to straddle this balance of how do we simplify and standardize as an organization around what work, what we call this year, our core tools and still allowing some opportunity and flexibility for teachers to be innovative in their instructional practice? Because there are some good resources out there that, you know, teachers grab, and they’re highly innovative, and they’re effective with it.
36:22
So, you know, we did identify 5, 6 key digital tools that kind of laid out the expectation, that this is, the standard tools that all teachers need to utilize and engage with as their core instructional practice.
36:37
And, you know, working with our staff development specialist and our digital learning coaches, teachers, that wanted to explore some different tools on a limited basis, still have some flexibility, an opportunity to navigate around that space.
36:56
And so, as we think about the future of data collection, no, again, no data process isn’t really changing from what we’ve been doing in our system.
37:07
And I suspect some of you on this, on this call have great data processes in place.
37:14
The challenge is, and the place that we’re in is how do we take those really great existing spaces and adapt them to our new learning environments and adapt them for collecting new, meaningful data, to drive where we want to get to.
37:32
And so, for us, you know, we really run through continuous improvement cycles.
37:37
We’re going to be continuing with those continuous improvement cycles, but looking at potential different data elements, we’ve got a new strategic plan that is being built right now, and will be launched for next school year. And we’re really being intentional around this new strategic plan, around having measurable outcomes attached to each of the strategies in it, and then pairing it with what we’re calling monitoring reports that we can gather that data and bring regular monitoring reports back to our organization and our school board to understand how we’re progressing through that plan.
38:16
You know, we have a budget process. Within our organization, we do zero based budgeting, so, everything’s on the table every year. And, as, you know, budget managers and leaders bring proposals together. They have to have data measurements identified with their budgetary proposals. And how are they going to measure the outcomes of what we’re investing in to bring alignment to the things that aren’t effectively working and how we need to maybe re-invest in a different way? And, you know, as always, looking at data to drive our instructional practice and get the desired outcomes. So, the promising practices study that I mentioned, of looking at focus or sample groups of teachers and the practices that they’re doing in their classroom, and aligning that to the outcomes that we’re seeing.
39:07
And utilizing that to reinforce the, the practices in the classroom that really get us to where we want to be moving forward.
39:21
So, you know, the key takeaways that I will leave you with, if you’re just starting on your journey, around data, within your organization, keep it simple, and build upon it.
39:33
Know, find the 1 or 2 data elements that you want to focus on, and work on those pieces to start to build, again, that capacity and culture within your organization. When I was in Richfield, data was a new concept to that organization, so we had to start simple. We worked with buildings and building leaders and staff to say, this year, we’re just gonna focus on math, what are the strategies we’re using with math.
40:01
What are the outcomes we want to see coming out with math, keeping it simple, keeping a focus that we can have a common vision and alignment with everybody in that same space, you know, clearly identify and define what you want to know.
40:18
Like I said, we are as schools, and school systems were data rich. We’ve got data and just about everything.
40:26
But, bringing that together in a meaningful way to put together a process and inform us on how we take actionable steps, we need to get back to, what is it that we clearly want to answer? What is that question? What is that goal? Think about what you already have in place and how it can be adapted. As I mentioned, I am suspecting, many of you have data, processes, and protocols you might have PLCs implemented. So, again, think about what you already have, and how does that get adapted in our new environment.
40:59
And find technology solutions that can assist.
41:03
Again, with, you know, having data everywhere gets to be challenging and cumbersome. So finding how technology can be leveraged and utilized to bring that data together and synthesize it. So, we can spend more time on our conversations about next steps and actions, as opposed to trying to put it all together just to see and identify the problem that we have.
41:26
And then always keep in mind the alignment with your district and school goals and strategies. Again, bringing in data that’s not connected to any goals and strategies isn’t going to lead your organization anywhere.
41:37
There needs to be alignment and a path as, as you continue to move your work forward and think about how you’re going to utilize that data to drive what comes for next school year as we start to slowly move out of move out of the pandemic and into this post pandemic learning experience.
41:59
So, I’m gonna thank you for, for the time, sharing my experience with all of you, and I’m gonna turn it over to Aiden Kahn, who’s going to share a little bit about the Lightspeed system itself.
42:15
Thank you so much, Anthony.
42:16
Really enjoyed, you know, listening to your presentation, it’s been an ongoing pleasure to really partner with a true pioneer in the data analytics space.
42:43
So once again, my name is Aiden Kahn, I am a Regional Sales Manager here at Lightspeed Systems, and excited to talk about some of the main themes that Anthony illustrated during his presentation.
42:57
So, really kick things off.
43:00
We do a lot of ongoing conversations with our customers, just to learn what their day to day worlds are, like, what sort of challenges and opportunities they found, especially over the past year.
43:14
You know, everyone’s kind of reacted in different ways, and one of the common themes that we’ve seen is just the rapid adoption of new educational tools. As you see here, the average district has used over one thousand educational tools every month, which is a 90% increase in the past year.
43:31
And, you know, as Anthony said, so many teachers are pulling the tools to try using the classroom, it’s really important to understand which ones are actually getting used. You know, talking with students which ones are easy for them to grab.
43:45
And making sure that moving forward, you consolidate with the right solution.
43:49
And that kind of plays into that second data point, about 57% of all district licenses that are purchased our own use. And that’s just because you don’t necessarily always have good visibility into what’s being used. You might be hearing from a small subset of the population who loves the tool, and it might be a great fit for them, but maybe it’s not the right fit for everyone. And by understanding, the better you can start to make those strategic decisions on right sizing certain subscription renewals and making sure that each student body or each grade level or each school has the solutions that are right for them.
44:26
Another thing that was very surprising to a lot of the technology teams that we’re working with, is just the number of unauthorized applications that are found on the district network. And, maybe, it shouldn’t have been as much of a surprise because, once again, the adoption of all these new tools going into online learning for the first time, but because, you know, online learning is now a necessity everyone’s going to react to that in a new way. And just by better understanding what applications are on your network, you can make the decision, both from a student engagement standpoint, and also from a data security standpoint, which tools need to be on your network moving forward.
45:06
Now, some other numbers aren’t on your customers that have not use our Analytics tool, collectively are spending $37 million on your licenses. You know, once again, two–thirds of all licenses on average are going on, you, you can start to see how those numbers start to add up pretty quickly.
45:22
And by just implementing Analytics, the district, they’ve been able to save, you know, $300,000 you’d like to be caught by right sizing there, there renewables coming up in the next year or so know maybe in some cases where you’re saving you 100,000 and somewhere saving 500,000. That’s really one of the main goals behind. What we’re doing here is to help you understand how to better leverage the funds available to develop the right mix of software applications for your district.
45:52
Another thing that I’ll be getting into later, is, beyond just which applications are being used. There are other applications that, even if they are being used, maybe aren’t the right fit for your district, based on what they’re doing with your student data. That’s always a growing concern, is more and more applications and more online learning is happening is, how can we make sure that we are being an application that we are entrusting or student data to are being faced. So, that is a huge component of the analytics piece that we’ll be talking about today.
46:23
Just some background, you know, I’m sure most of you hopefully have heard of us, but we are working with more school than any other provider in the industry. And that really gives us the opportunity to learn from them and better update and revamp and, you know, help them out with new products and new ideas, based on the feedback that we get every day from the customers, we have the opportunity to partner with.
46:46
As we’re talking about, the different solutions today will mostly be focusing on the analytics piece. You know, we, a lot of you might know about us from our web filtering. We also have some other solutions such as alerting for student safety, an MDM solution, and a classroom management solution for teachers to see students’ screen.
47:04
But what we’re really going to dive into more today and really based off of what Anthony was able to share about new learnings from this past year and how that impacts decisions going into next year is the analytics that we’re able to pull.
47:17
You know, right here, I think, is something Anthony mentioned, that track recorded, just the ability to have to spend less time, meaning to process the data and more time strategizing and having those conversations with your team. That’s really what the solution is designed to do. You know, you don’t have to necessarily pull data from 12 different sources, and then, you know, make those different graphs and charts. We’re gonna be doing a lot of that to, to help facilitate those conversations on which direction to move in.
47:46
With this data, it’s very important to understand, you know, where devices are being used, how they’re being used, who is using them, for which different applications.
47:58
All this stuff that is kinda pulled into the Analytics platform to help you better understand, you know, all the different data points that come from, you know, managing a school district network.
48:10
One of the big parts, and I know some of it jumps out from a number standpoint, but as optimizing your technology budget, I think the first step to optimizing it is, once again, that identification piece.
48:23
You know, how can you understand which tools to move forward with if you don’t know which tools are being used.
48:29
And then once you know which tools are being used, are we buying the right number of licenses for our district?
48:37
So, you know, maybe it might be something like Anthony mentioned, the LMS where they bought it district wide and then found out that maybe it wasn’t the best fit for the K through five student.
48:47
Then we can write code that only use it for the 6 through 12, and purchase something else for the K through five that better fits what they’re hoping to accomplish.
48:56
As we start to see two–thirds of tech licenses not being used, this is how you can make those decisions, and have that quantitative evidence on which dilution to eliminate, or which solutions to reduce moving forward.
49:09
And also, just from an individual usage standpoint, you know, how often in which groups are using individual application, as you see here, it, you know, Achieve 3000, for example.
49:24
Bouncing over to the Data Compliance section, a lot of states are now introducing their own data.
49:30
Privacy compliance, regulations that we want to make sure are followed both on the federal and the state level.
49:41
We’re doing all of that vetting ourselves, making sure that any applications that are seen by our database, we’re making sure they are being saved with student data.
49:51
From a retention standpoint, for how they’re sharing your information, or what their commitments are to certain privacy pledges, FERPA, COPPA, it’s not going to be a manual process of first of all identifying what applications there are, and then getting there, getting their commitment to certain data privacy statute.
50:13
We’re going to be doing all that work for you to, once again, enable you to have more time to have this conversation, rather than having to gather all their data yourself.
50:24
Kind of moving on to some of the different options that are available within Analytics.
50:30
I think another thing that was really powerful, and Anthony mentioned having different reports that are maybe some are more down to the classroom and some are up to the boardroom.
50:39
You know, everyone’s going to have different information that they’re looking for, and we’re trying to provide you a variety of different reports that can be used to answer several different questions right here. You have so many different online tools that are being implemented all the time. And maybe, you know, one board member asked a question about if learning is taking place more during school or after school. And maybe someone else is concerned with which students are at risk of falling behind, because there just aren’t engaged on a day-to-day basis, and maybe a third person is concerned about which applications are presenting potential risks from a data compliance standpoint – What are our most use unapproved app?
51:16
So, like having all this, you’re ready to go, you’re not going to have to, you know, once again, have to pull these reports. Every time you get a request, you’re going to be able to monitor these from an ongoing standpoint.
51:29
The other thing I’ll call attention to this app usage report, this is a great way to figure out, and, once again, the example of teachers bringing in all these new free tools. Which are the ones that we actually see gaining traction in gaining adoption with the students. We introduce something new, we would like to see it gaining more adoption, and gaining more engagement. This is a great way to have ongoing data on how that rollout is going, and maybe if we have to allocate some additional PD resources, not growing in quite the way, that we hope.
51:58
This will be a familiar name and face here. That is, Anthony, our wonderful co-host today.
52:05
But we had the amazing opportunity to see it firsthand, within his team and helping them save a ton of money on, you’d like them to sustain and within Analytics, and really just getting overall insight and awareness into how applications are being used, different ways in which we can better achieve our strategic goals that we’ve outlined.
52:28
So, it’s been, you know, it document here has been invaluable to Anthony and working with Anthony has been invaluable for us.
52:38
And then kind of something that I touched on it, but having this data in real time and ongoing is so important. It doesn’t have to be something that is, you know, once a quarter cap on your list. Like, oh, now I have all these reports for, you know, a board meeting or for review.
52:55
You’re gonna be able to monitor the ongoing and make strategic decisions based on what might be working and whatnot, what might not be working, know, as we see in this copyright with the geolocation, one thing Anthony mentioned is part of student engagement is knowing where students are. You know, students are learning at home. Do we make sure that we understand where they are, where their devices are?
53:19
Anything that goes along with device recovery and then just from ongoing measure against district goals, are we meeting those? Is there anything that we can do to better address?
53:31
So it is really important to have something like that that you can come in whether it’s once a day or once a week and just kind of check as a barometer against some of the goals that you’ve outlined.
53:43
Was a pleasure speaking with you today, I hope you found it interesting once again here as a reminder on some of the different products that we offer.
53:52
I might not have reminded you before, but we are taking questions, so hope you had the opportunity to submit questions into the question box, because we’d love to answer them. If not, feel free to take time now and submit those questions, but thank you so much for your time.
54:14
Thank you, Anthony, and in both, for your very valuable insights, that was such a great session. There is so much valuable content that was discussed. Really appreciate you joining us today, Anthony. I mean, that was a really, really good discussion. I’m excited we’ve had a lot of questions already come in. If you have a question, please enter it into the question box. We will do our best to get to it.
54:37
But without further ado, let’s go after some of these questions that have been submitted.
54:42
So here’s one for Anthony, says Anthony, was there any data you collected during this past year that surprised you?
54:54
I think my pause is causing me to say no, right away.
55:00
And I think it’s just because we ban so dug into data for the last, you know, for a long time. But really over the last several months just looking at everything on a pretty regular basis.
55:14
That no, it wasn’t too surprising, you know. I think there were there was data that was exciting so you know as we went into the pandemic, last spring and being able to pull in that engagement and usage data to see that on a regular basis. We had 96% of our students showing up. That was exciting and I would say surprising compared to, you know, what we’ve heard as challenges nationwide around students, you know, engaging in that remote learning environment, as we got into that space.
55:53
Awesome, here’s another one for you. And it says, what kind of data is requested by district admins like superintendents?
56:03
Oh it changes, and it evolves, I would say right now, our most common data points that we’re looking at is just absentee rate. Because we’re backend person, we kinda watch to see, you know, what does absences look like with staff and students, in order to make sure in person learning can function.
56:21
Which has been, you know, a little different where we’ve got our online schools serving 5000 students right now, and has about a quarter of our staff that operates differently with absentee rate. So, I would say absentee is probably the most common data point. We’ve been polling for the last, you know, several months when we started the pandemic engagement was the data that they wanted to make sure that students were showing up in our space and being connected.
56:49
So, again, it’s, it’s evolved over the course of the year, mm.
56:55
Absolutely, this one is for Aiden, does only track applications the school installs, or does it track student downloaded apps as well?
57:06
Yeah, that’s a great question. And I think that is one of the valuable parts of the product, is that it’s going to give you an overview of any application that’s running on your network, or on one of your school devices. Because I think sometimes the most valuable part is that stuff that you don’t know. And definitely a big part of that identification standpoint.
57:26
Being able to track even the ones that you then push out centrally, yeah, I can add from experience. That was one of the highlights right away with, with the Analytics tool is it from a Cybersecurity lens. It gave us the insight into everything that students were, were utilizing our teachers were utilizing in the classroom.
57:49
That’s awesome.
57:51
This one’s for you Anthony. It says, I’d love to have access to this information, but I’m not sure it’s a necessity. Is data tracking a necessity in your district?
58:00
Um, I would say it depends in more of what’s behind that question. But I would say, yes, data tracking is a necessity within our organization and it’s a part of our culture. And, you know, really to drive our performance and our outcomes, and to make sure the strategies or as a software tools that we’re investing in are actually getting results.
58:34
This one is for Aiden. Does Analytics collect data if the app is used on a browser?
58:41
Yes, it does.
58:42
So that’s another part of the, I guess, wanting to provide a complete picture, is regardless of where the application is used, or how students are accessing it, we, of course, want to give you that information that it is being used.
58:55
Got it. This is another one for you. It says, does this data report in real-time, or is there a lag?
59:03
Sure. So, yeah. Good question there, and it does report in real time.
59:06
I think that kind of speaks to that, the opportunity you have to review it on an ongoing basis. As Anthony mentioned with making sure we’re aligned with certain district initiatives and goals, is having that real time reporting information.
59:22
Awesome, OK, well, these questions are amazing, and we are just at the end of our time limit for today, so we have time for just one more question. If you asked a question and we didn’t get to, we will follow up with you after the webinar’s over via e-mail to make sure that your question gets answered.
59:40
So, last question: Anthony: Have you seen a difference in the outcome of meetings and approval with this type of data?
59:48
Um yes.
59:51
I would say so, because it really steers the conversation when we’ve got the data to have the conversation, as opposed to I’m hearing this, I’m seeing this. Well. How? How much is that being observed?
1:00:08
How, how much does that actually represents, you know, the whole population of utilization.
1:00:15
There are tools where, you know, we hear from some staff members, that, you know, this is the best tool, and everybody’s using it, and everybody needs it. But then when we look at utilization, it’s, you know, it might be 2% of our entire school district, which then raises the question, and has the conversation as we share back with no staff members or teams.
1:00:38
Here’s what’s actually happening, so then we can get into a different layer of conversation.
1:00:43
You know, as Aiden kinda mentioned, if this is something we really need to use.
1:00:47
Then we either need to provide the professional development supports to get higher level usage, or it’s not being used as well as we want it to be.
1:00:56
It’s not effective the way we want it to be, and no, we have to make the decision to move past it and move on to get the effective strategies in place.
1:01:06
Yeah, that’s awesome, thank you.
1:01:10
We are out of time, actually, over time. So, thank you for staying on with us. And thank you to both of our presenters. I really appreciate all of the valuable content you brought to the table today. And thank you to all the audience members. Again, we know your time is super valuable right now. Your schedules are crazy. So, we really, really appreciate it.
1:01:31
Click on either to fill out that survey at the end of the webinar, and we’ll send you a $10 gift card.
1:01:37
And last but not least, we do have another webinar coming up next Wednesday with tech and learning about building a sustainable, social emotional learning environment. So, we hope to see you there.
1:01:54
Thank you all again for joining us, and have a great rest of your day.
1:01:58
Thanks, guys.
1:02:01
Thank you.
Safety, security, and equity. At the speed of light.
Phoenix House
Christopher Martin Rd.
Basildon, Essex
+44 (0) 20 4534 5200
Still doing your research?
Let us help! Schedule a free demo with one of our product experts to get all of your questions answered quickly.
Looking for pricing information for our solutions?
Let us know about your district’s requirements and we’ll be happy to build a custom quote.
Reimagine the inspired and interactive classroom for remote, hybrid, and in-person learning. Lightspeed Classroom Management™ gives teachers real-time visibility and control of their students’ digital workspaces and online activity.
Ensure scalable & efficient learning device management. The Lightspeed Mobile Device Management™ system ensures safe and secure management of student learning resources with real-time visibility and reporting essential for effective distance learning.
Prevent suicides, cyberbullying, and schoolviolence. Lightspeed Alert™ supports district administrators and selected personnel with advanced AI to detect and report potential threats before it’s too late.
Protect students from harmful online content. Lightspeed Filter™ is the best-in-class solution that acts as a solid barrier to inappropriate or illicit online content to ensure students’ online safety 24/7.
Gain complete visibility into students’ online learning. Lightspeed Analytics™ gives districts robust data on the effectiveness of any tools they implement so they can take a strategic approach to their technology stack and streamline reporting.