Real-time data can reveal patterns in specific neighborhoods or regions where K12 students consistently face poor (or no) internet access when off-campus. Unlocking this kind of community-level visibility is key to identifying large-scale solutions to the homework gap. Unfortunately, reliance on manual and incomplete data collection has traditionally left districts in the dark.
Let’s dive into key data points districts need to begin closing the digital divide in education—and how to leverage new technology to support students at scale.
Unlocking Real-Time Off-Campus Connectivity Data
Districts often turn to internet service provider (ISP) maps, state broadband maps, free-and-reduced lunch data, or self-reporting to understand where large-scale support is needed. However, these sources are often insufficient for decision-making. The data is often outdated quickly, is too broad, or is partially accurate. For example, a recent look at the Texas Broadband Development Map reported below optimal internet accessibility at NASA’s Johnson Space Center in Houston. While this result is realistically unlikely due to the nature of the Center’s operations, this example demonstrates some of the data challenges presented by these map tools, despite the best efforts of the entities creating them.
When districts rely solely on these maps, they are working at a disadvantage and students are the ones who are impacted. What districts need – and students deserve – is accurate, real-time data.

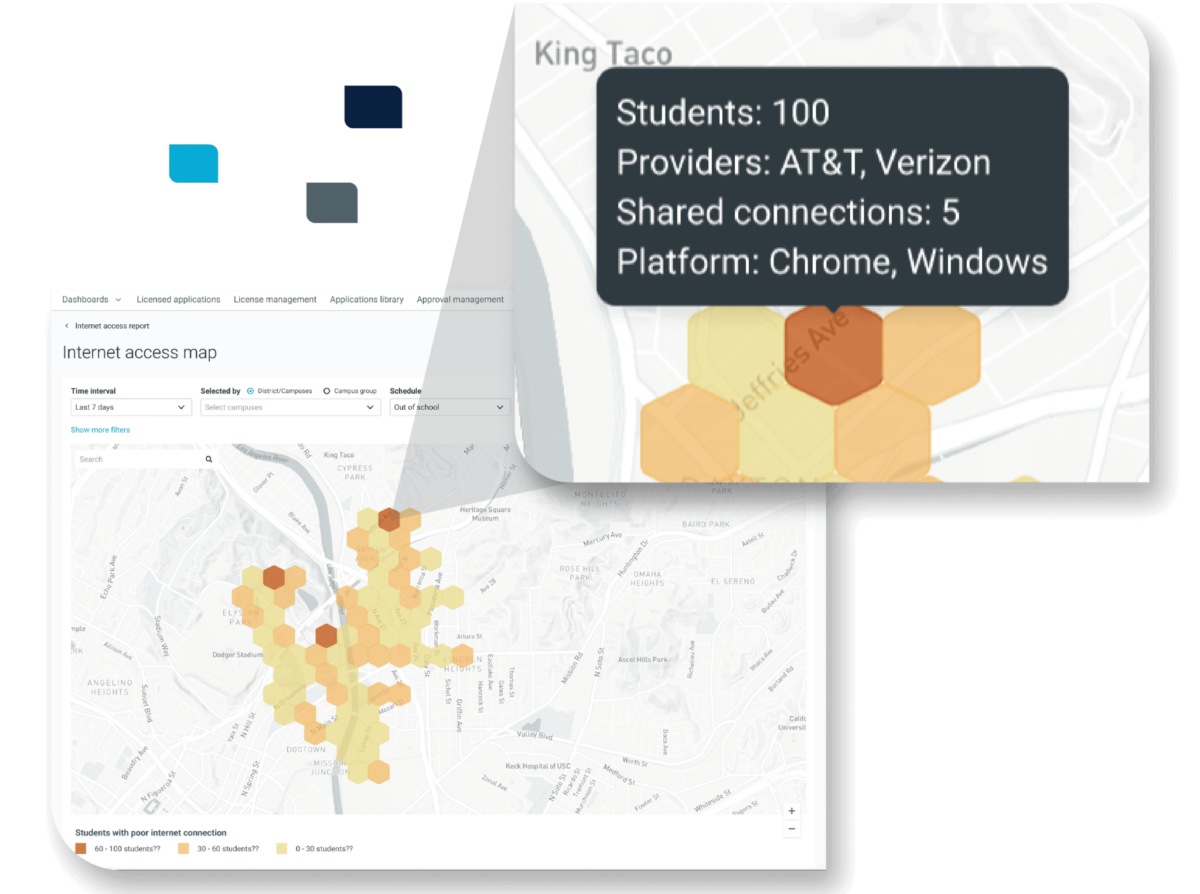
By harnessing this type of geographical data, such as that provided by Lightspeed’s Digital Equity Module, school leaders gain a real-time, neighborhood-level overview of students’ off-campus internet experience while preserving student data privacy. With this kind of visibility, districts can more easily identify and communicate long-term connectivity solutions such as infrastructure investments and partnerships with ISPs, community organizations, and policymakers.
Using Data to Drive Strategic Investments
Visibility is the first step to solving needs on a community scale. By pinpointing neighborhoods with limited or no internet access and understanding how many students in the district within that region are affected, education leaders can identify appropriate solutions and make more informed decisions regarding their strategic investments. Additionally, districts can use this data to assess whether new or existing solutions are adequately meeting demands. From there, they can change what is not working and replicate what is across other areas.
Pairing that information with more granular details about a particular region’s connectivity landscape can give districts additional clues to guide large-scale developments. For example, seeing trends in the types of service providers used in areas with poor connectivity, or the upload and download speeds of those providers, gives districts direction on which ISPs to speak with about broadband optimization. This is particularly relevant for students who lack off-campus internet access due to their residence in rural regions with internet dead zones. In these cases, districts may opt to work with government agencies or internet carriers to advocate for infrastructure investments like regional cell towers.

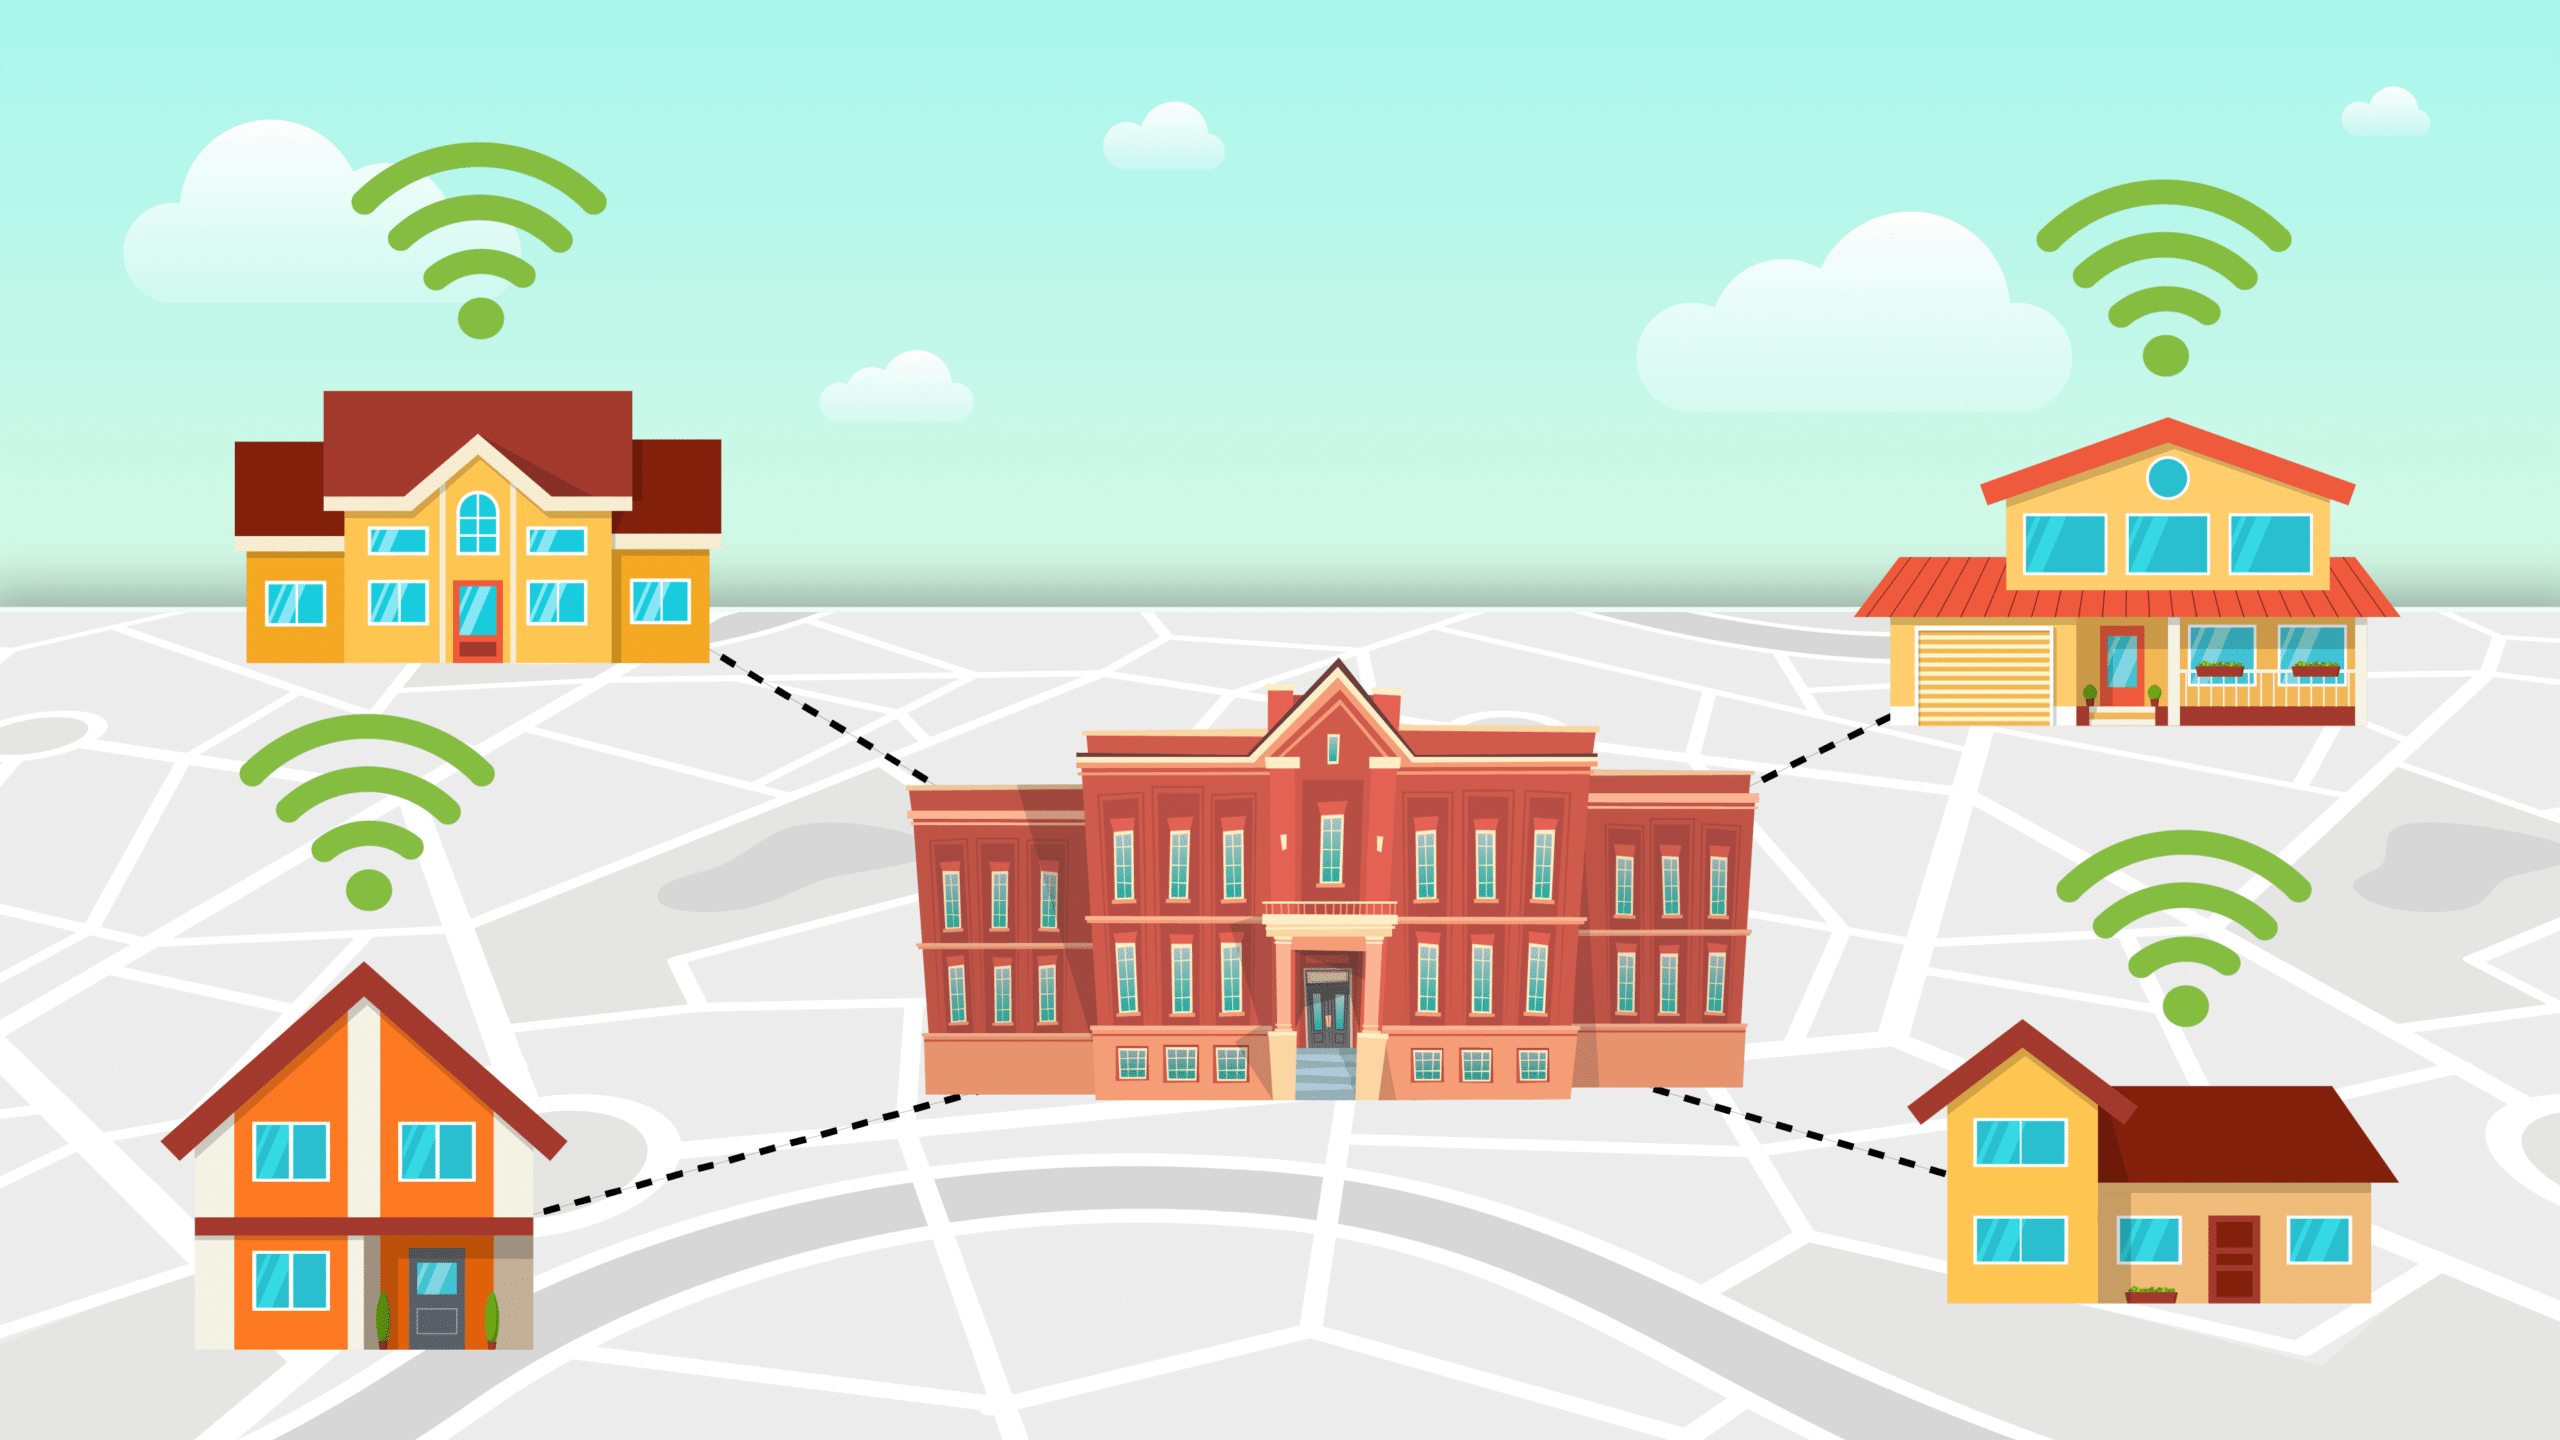
Additionally, understanding the extent to which networks are shared within a particular region (a factor which degrades students’ ability to connect to digital learning) helps districts determine where community partnerships—such as those with libraries or recreation centers—may be necessary to expand internet accessibility. It can also bring to light if existing resources are simply not well known and accessed. Data helps understand if the answer is to increase internet partnerships or improve the use of ones that already exist.

Further, details about upload and download speeds within a neighborhood can reveal where high-speed internet is available but not affordable, such as within migrant camps or areas with low household incomes. Real-time data makes it easier to uncover these nuanced challenges so districts can have effective community conversations and deploy appropriate solutions.
Conclusion
By leveraging new technology, educators can make well-informed investment decisions to bridge the digital divide at scale. Learn more about how Lightspeed’s Digital Equity Module can help!

Want to learn more about Lightspeed’s Digital Equity Module? Contact the Lightspeed team today.

